Pages

Subscribe:

Ads 468x60px

Creative Commons License

Clustr Map

Math Chat

Search This Blog

Showing posts with label Dom 817. Show all posts

Sunday, March 11, 2012

Dom's Surface area and volume post

Rectangular Prism:


Triangular Prism:


Cylinder Prism:


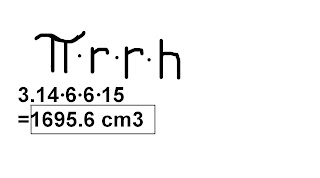
Volume:


Monday, February 13, 2012

Pythagorean Scribe/ Textbook pythagorean questions

1. Answer in a short paragraph and with diagrams

1. Explain what the pythagorean relationship.

a2+b2=c2
a2+b2 = c2 because the 2 legs are smaller than the hypotenuse and for it to equal c2, you have to square a2 and b2 and square root it after to get the hypotenuse(c2).


2. Solve for the missing side length.

a= 5cm b= 12cm c=?
c2=a2+b2
c2=5cm2+ 12cm2
c2=(5x5)+(12x12)
c2=25+144
c2= 169cm2
c=13cm


3. Is this a right triangle? Prove it!

a=6cm b=8cm c=11cm
a2+b2=c2
6cm2+8cm2= 11cm2
(6x6)+(8x8)=(11x11)
36+64=121
36+64=100
c=10

It is not a right triangle because it doesn't equal the hypotenuse.


Textbook Questions pg. 92-93 # 5,9,13

5.A right triangle has side lengths of 40mm, 75mm, and 85mm.

a)Sketch the triangle. Draw a square on each side of the triangle.
b)What are the areas of the three squares.

b)40mm= 40x40= 1,600
75x75= 5,625
85x85= 7,225

c)Write an addition statement with the areas of the three squares.

c) 1600+5625+7226= 14,451 mm

9.Calculate the areas of the three squares

4cm= 4x4=16cm
2x2= 4cm
3x3= 9cm

b) Is this triangle a right triangle? Explain.
b) No because 2+3 cm squared has to equal 4cm squared but it does not. 9+4 does not equal 16.

13. A small triangular flower bed has a square stepping stone at each of its sides. Is the flower bed in the shape of a right triangle? Explain your reasoning.

It is not a right triangle because the 2 legs (4800cm) has to equal the hypotenuse (9800cm) if u add them up. 4800+4800=9600 cm
not 9800cm.


Sunday, January 22, 2012

TextBook Questions pages 98-100 #6, 15, 17 Dom817

6. What is an example of a whole number that has a square root between 9 and 10.

An example of a whole number that has a square root between 9 and 10 is 82

15. Order the following numbers from least to greatest: 7, square root 46, 5.8, square root 27, 6.3

Sqaure root 27, 5.8, 6.3, square root 46, 7

17. Carmel wants to mount an 18 cm x 18 cm square picture on a square board that is four times the area of the picture.

a) What is the area of the picture?
b) What is the area of the board?
c) What are the dimensions of the board?

a) 324cm squared
b) 1296cm squared
c) 36 cm squared

Wednesday, December 14, 2011

Dom's Percent Textbook page 149 (4,5,6)

Question 4.

Chris Purchased the following items:
- 2 binders at 4.99$ each
- 1 math set for 3.99$
- a backpack for 19.99$

Find the total cost including 5% GST and 7% PST.

4.99$ x 2= $ 9.98 9.98+3.99+19.99= 33.96
5+7=12 12/100= 0.12 0.12x 33.96= 4.08
4.8+33.96= 38.04

Question 5.

Ravi purchased 3 DvD's for 19.99 each. Find the total cost for the DvD's including 5% GST and 6% PST

3x19.99=59.97

5+6= 11 11/100= 0.11
0.11x59.97=$6.60 6.60+59.97= $66.57

Question 6.

A store discounted items by 50% off theoriginal price one week. The followingweek an additional 10% was taken off thealready reduced price. The regular priceof a CD player was $85.00. What is thereduced price in the second week?

50/100=0.5 0.5x 85.00= 42.5 10/100=0.1
85.00/2= 42.5 0.1x 42.50= 4.25

42.5-4.25=
38.25

Thursday, November 10, 2011

Dom's Graphing Post

1. Use your notes to list the different types of graphs. Please list the advantages and disadvantages of each graph.

There are 4 different types of Graphs

1. Bar Graph- It is best for comparing data across categories

Advantage: It shows the categories what has the most and least.
Disadvantage: The intervals sometimes make the bars look like it's almost the same but it's not. To make it not look the same you can change the interval by breaking the y-axis.

2. Double Bar Graph- It is best for comparing 2 sets
of data across categories.

Advantage: You can see the differences in the groups you are compar
ing.
Disadvantage: You can get confused if both of the bars are together and they are the same colour.

3. Circle Graph- It is best for compa
ring category to the whole using percents.

Advantage: It shows the total of percent for each categories and you can easily see what category has the most or least.
Disadvantage: You have to find the actual number.

4. Pictographs- It is best for comparing data that can be easily counted and represented using symbols.

Advantage: You can see the category getting higher or lower
.
Disadvantage: You have to find the actual number.

5. Line Graph- It is best for showing changes in data over time.

Advantage: You can see if it's incre
asing or decreasing.
Disadvantage: You can't see the comparisons.

2. How can graphs be misleading. Show 3 ways.

1. In a bar graph you can Break the y-axis
2. In a pictograph you make a sy
mbol or a picture larger than the others
3. In a bar you make the intervals close together.

3a) The following chart shows Pizza Sub Sales over a month. What 2 graphs would show the information accurately?
3b) If you were selling Pizza Su
bs would you continue? How does your graph explain your answer.

3. a) I would use a bar graph and a Line graph.
b)
I would continue because it shows how much I'm selling.


4. Below you see 2 different exampl
es of graphs showing healthy choices sold at the canteen. If you had to convince Mrs Mota that we should continue selling healthy choices which graph would you choose? a) Change each graph so that your information looks even MORE impressive. You may not change the data just the graphs.

I would choose the line graph because you can see it increasing.


Wednesday, October 12, 2011

Dom's Proportion Post

1. Definitions.

Ratio: A comparison of two quantities that have the same units.
Example: 4:5 and 5:6
Rate: A rate is a comparison of two quantities measured in different units.
Proportion: A Proportion is an equation which states that two ratios are equal.


2. 5 hours to travel 360 miles is about 72 mph
5h÷5=1h
360m÷5=72m


As a playgroup worker, if I increase the amount of apple juice I am serving at the playgroup from 25 ml to 100 ml, how much should I increase the the orange juice to, to keep the quantities in the same proportion? The orange juice is 50 ml to start with.
25x4=100ml
50x4=200ml


3.What are the three ways you can prove that equivalent ratio statements are true?
3/4 = 12/16 or 4/9 = 16/32


4.


5.Does this seem fair? Well to me this isn't fair because the homeless guy only stole 100$ and got sent to jail for 15 years and the rich guy stole $3 billion and got sent to jail for only 40 months.

This isn't fair because the rich guy stole a lot more money than the homeless guy did and the rich guy only got sent to jail for 40 months. The homeless guy only stole $100 and got sent to jail for 15 years. It should be the other way around. The homeless guy should of been sent to jail only for 40 months and the rich guy should of been sent to jail for 15 years.

If I were the judge I would send the homeless guy to jail for only a year for confessing and send the rich guy to jail for 20 years.