


1.) Pictograph
advantages:
- Easy to read
- Visually appealing
- Handles large data sets easily using keyed icons
- Hard to quantify partial icons
- Icons must be of consistent size
- Best for only 2-6 categories
- Very simplistic

Advantages:
- Can compare multiple continuous data sets easily
- Interim data can be inferred from graph line
- Use only with continuous data
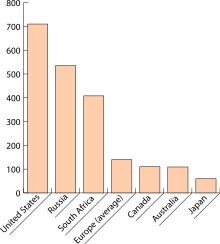
Advantages:
- Visually strong
- Can easily compare two or three data sets
- Graph categories can be reordered to emphasize certain effects
- Use only with discrete data

Advantages:
- Visually appealing
- Shows percent of total for each category
- No exact numerical data
- Hard to compare 2 data sets
- "Other" category can be a problem
- Total unknown unless specified
- Best for 3 to 7 categories
- Use only with discrete data

Advantages:
- It compares two sets of data.
Disadvantages:
- you could get confused by both of them together even if they are in colour or black and white.
-A pictograph can misleading because the pictures might be bigger than the other picture, and it might make it seem like its bigger.
2a) The following chart shows Pizza Sub Sales over a month. What 2 graphs would show the information accurately?
- A line graph and a Bar Graph.
- A line graph and a Bar Graph.
2b) If you were selling Pizza Subs would you continue? How does your graph explain your answer.
- Yes I would, because it shows that there are more sales.
4) Below you see 2 different examples of graphs showing healthy choices sold at the canteen. If you had to convince Mrs Mota that we should continue selling healthy choices which graph would you choose?
- I would choose the Line graph, because it shows how the sales went.
2 comments:
Kenzie, you were supposed to make your own picture instead of just taking one. Other than that, great job! :)
Hello Kenzie! Your post was great. You showed an example of each graph by putting in pictures. I also like how you explained the advantages and disadvantages of each graph, but, you need to explain them by putting in the definition also, in your own words. Your picture was great, but you are not allowed to take some picture from the internet, you need to make your own picture. You can make your picture if you use paint or take a picture of your own graph. Here is a video that you can add: http://www.youtube.com/watch?v=5KsqSXmjcXw&feature=related (Double bar graph)
Other than that, Well done! :)
Post a Comment
Note: Only a member of this blog may post a comment.