


Bar Graph
A - Shows which category got most or least.
D - Intervals may make bars seem very close, even though its not.
Double Bar Graph
A - Shows which set of data is better.
D -
Circle Graph
A - You can easily see which category is the best or worst.
D - You have to calculate the actual number.
Line Graph
A - You know whether the category is increasing or decreasing.
D - can only be used for data that changes over a period of time.
Pictograph
A - You can see which category got highest or lowest.
D - You have to calculate the actual number. Also symbols might might be different sizes.
2. How can graphs be misleading. Show 3 ways.
A pictograph can be misleading if the symbols are larger than others but they each represent the same amount.

A bar graph can be misleading if the intervals are close together and the bars don't show that much range.


A Line graph can be misleading because also if the intervals are close together. You wont notice if there is much increasing or decreasing.


----------------------------------------------------------------------------------------------------
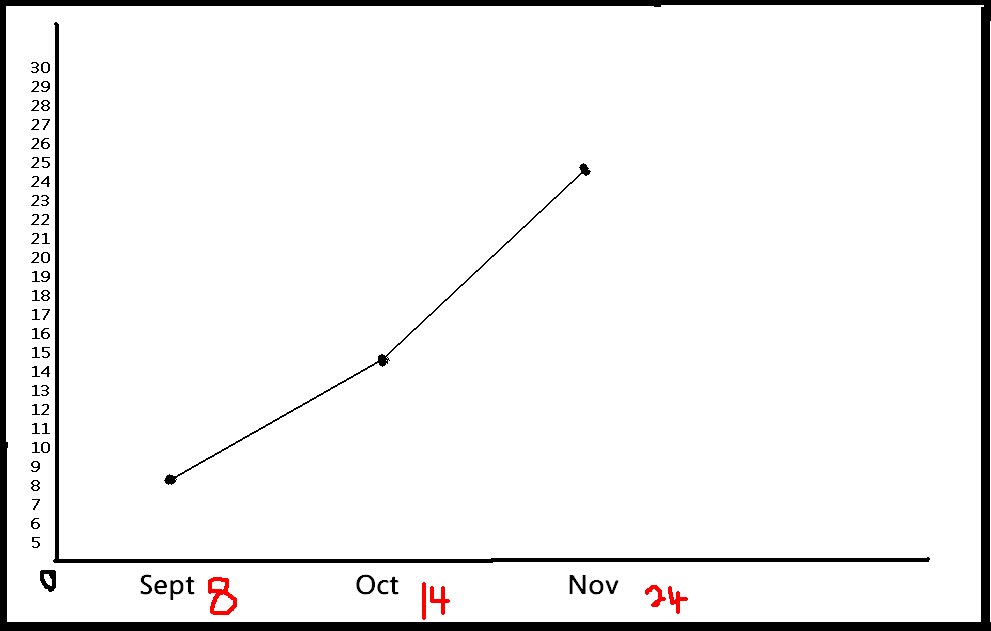
2a) The following chart shows Pizza Sub Sales over a month. What 2 graphs would show the information accurately?
A bar graph and a line graph.
2b) If you were selling Pizza Subs would you continue? How does your graph explain your answer.
e.x. A line graph would show that my sale of pizza subs is increasing every week. So, yes i would continue to keep selling pizza subs.
4. Below you see 2 different examples of graphs showing healthy choices sold at the canteen. If you had to convince Mrs Mota that we should continue selling healthy choices which graph would you choose?
I would choose the line graph because it clearly shows that more and more healthy choices are being bought every month.
4a) Change each graph so that your information looks even MORE impressive. You may not change the data just the graphs.

0 comments:
Post a Comment
Note: Only a member of this blog may post a comment.